Per-instance filter
Pick one BlueStacks instance (bs1, 127.0.0.1:5555, …) or view the whole fleet. The page subscribes to live Redis updates — no manual refresh.
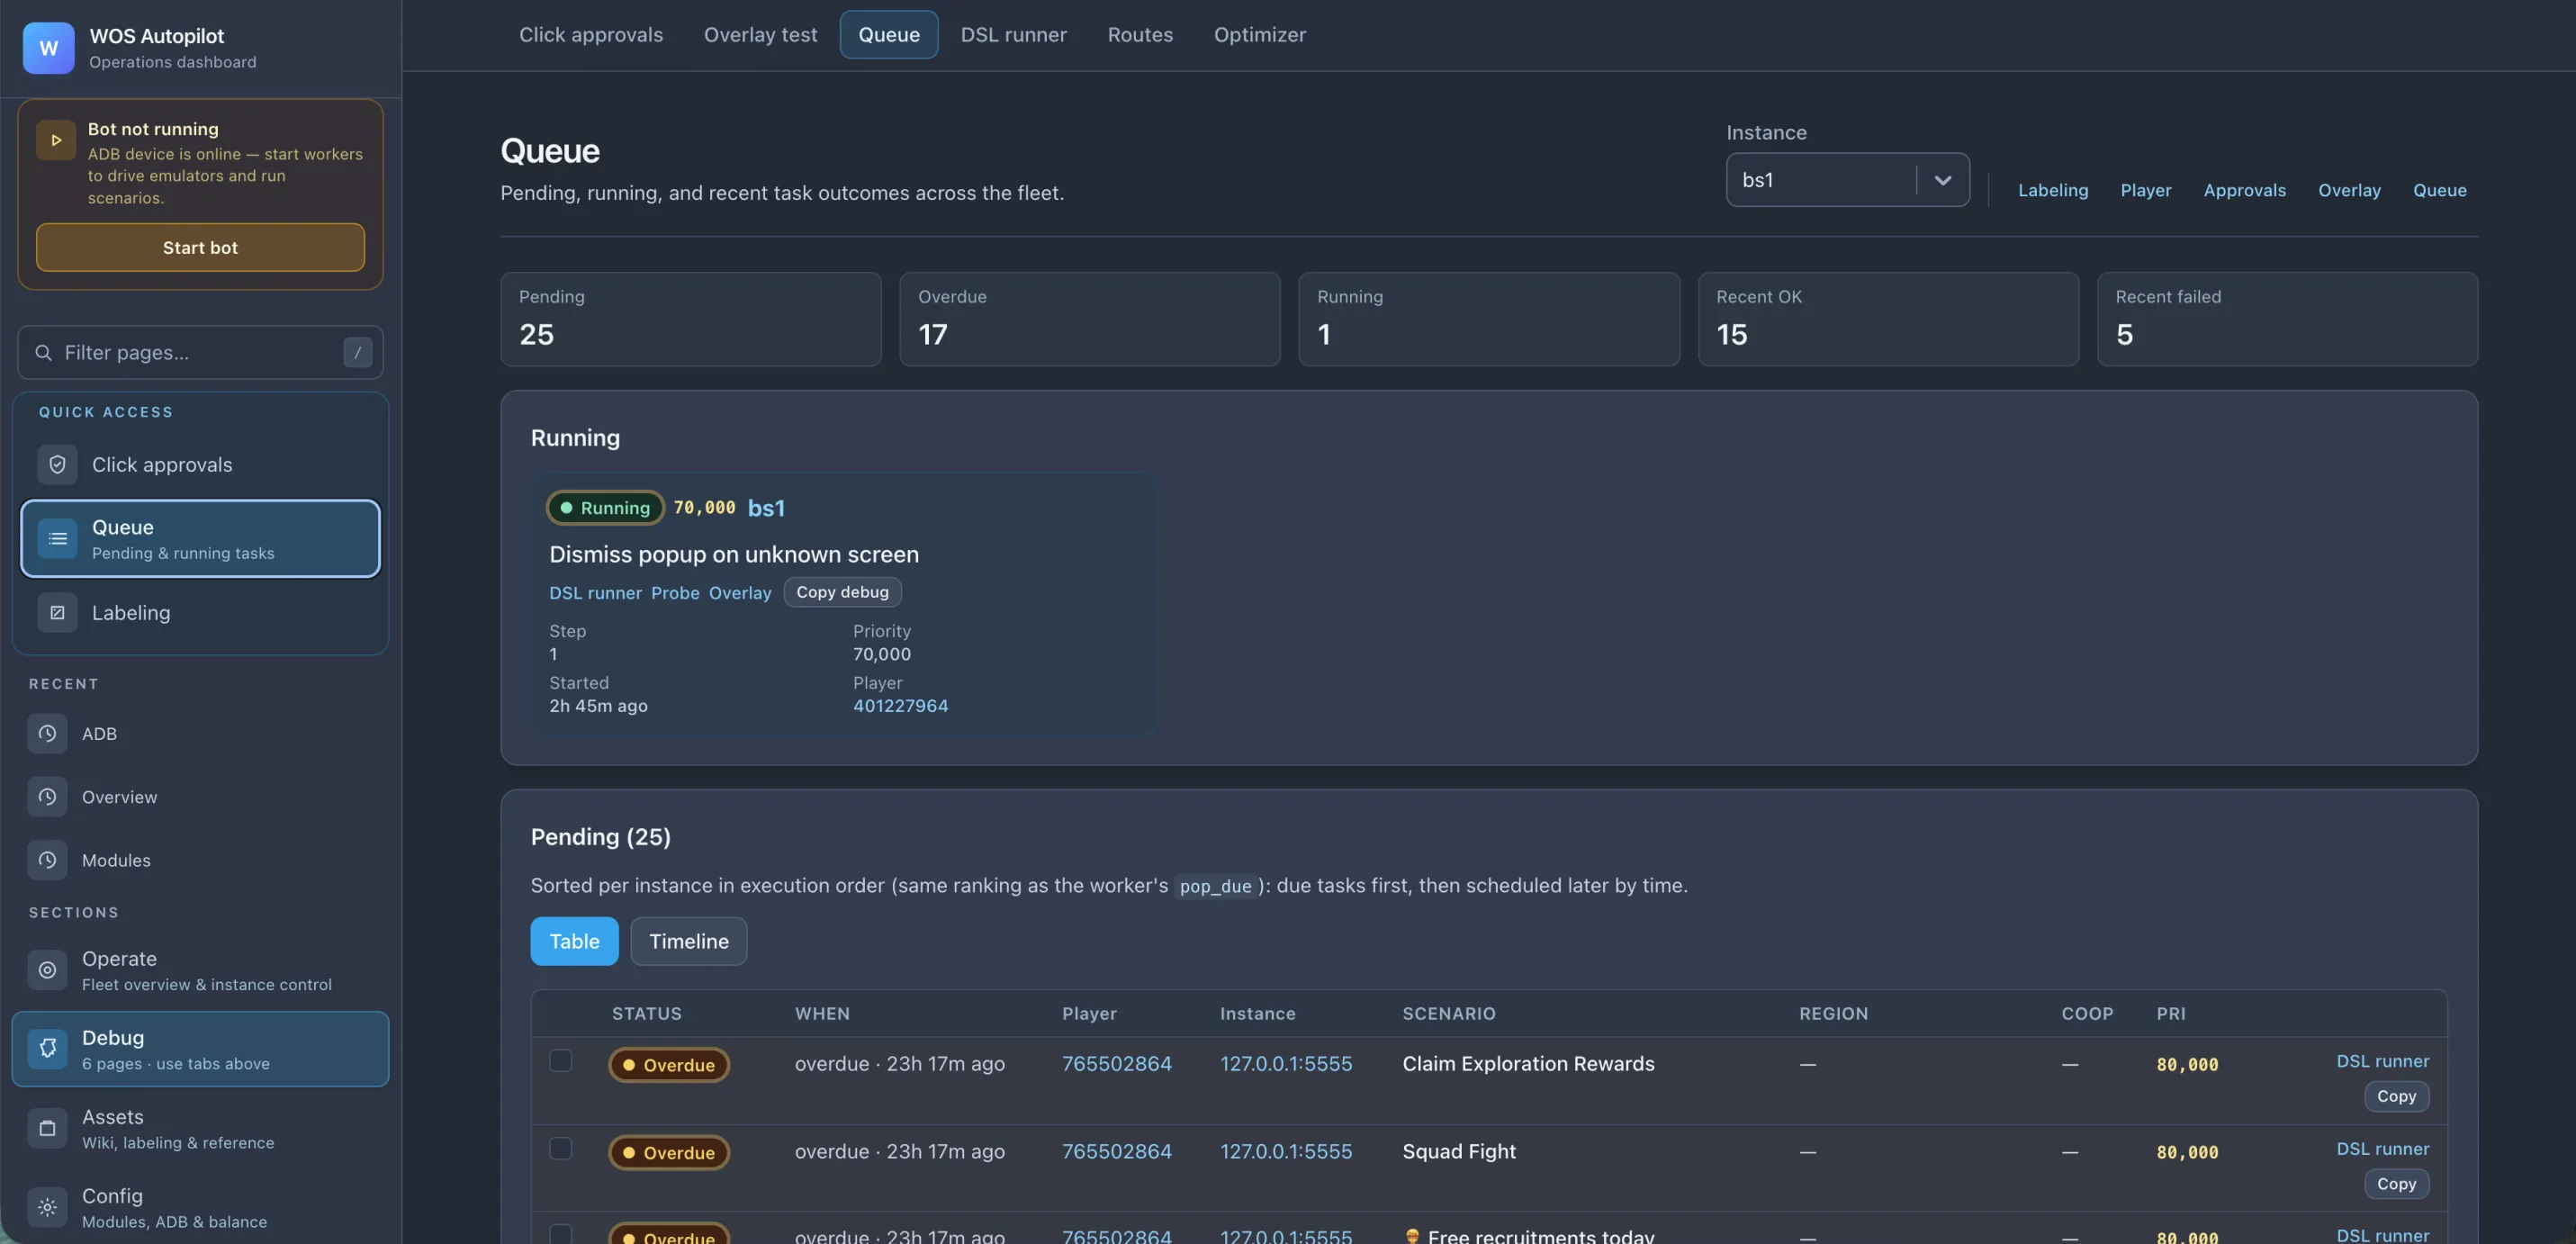
The Queue page is the central view of what the bot is doing right now and what’s pending. Everything goes through Redis (queue + history + state), so this view is restart-safe and reflects reality across all worker processes — including a worker that just crashed and restarted.
Per-instance filter
Pick one BlueStacks instance (bs1, 127.0.0.1:5555, …) or view the whole fleet. The page subscribes to live Redis updates — no manual refresh.
At-a-glance counters
Pending, Overdue, Running, Recent OK, Recent failed. The first place to look when something feels off.
Currently running task
What’s executing on which instance, with priority, current step, elapsed time, and the player ID. One click opens the DSL runner with the same state.
Pending table
Sorted per instance in execution order — due tasks first, then scheduled by time. Each row shows status, scenario, target region, priority, and quick actions.
The Table view is a list — best for “what’s stuck right now.”
The Timeline view is a Google-Calendar-style grid of upcoming scenarios across your instances. Each block is one scheduled task; rows are instances; columns are time. You can:
This makes the cron schedule a UI-editable object, not a YAML file you have to redeploy.
The Queue page is wired to every other operator surface — the top-right action row jumps to:
Use it as the “everything’s wrong, where do I start” entry point.